


.png)

Banking and financial institutions handle cash deposits and manage systemic financial risk. Such organisations invite higher scrutiny from regulators. In this industry, AI models’ reasoning is as important as their output. The problem is that AI decisions lack transparency, so financial institutions cannot deploy them freely.
Most workflows in banking and finance are extensive processes. This means the models must carry context across multiple steps. Anything left behind can impact the output.
Let’s consider a scenario involving a small business that has applied for a loan. Information about this entity is spread across stakeholders, bank statements, corporate registries, and so on.
The Two Layers of the Problem
The opacity problem and the context problem are related, but distinct. Conflating them leads to solutions that address one while leaving the other untouched.
- Opacity is what happens after the model runs. A credit model processes hundreds of variables and produces a risk rating. The rating may be accurate. But no one can reconstruct how the model weighed the inputs to arrive there. The reasoning is internal to the model, inaccessible to the humans accountable for the decision. A bank deploying such a model is effectively endorsing conclusions it cannot explain.
- Fragmentation is what happens before the model runs. The data a model needs to form an accurate view of a borrower is distributed across silos: core banking systems, bureau feeds, CRM records, regulatory filings, director databases, legal documents. Most AI systems ingest a slice of this and call it complete. The risk that matters is often in the data that wasn't ingested: the parent company's financial distress, the guarantor's cross-default obligations, the supply chain dependency that a competitor just broke.
Current approaches treat these as separate problems. The industry has built explainability tools to address opacity and data integration pipelines to address fragmentation. Neither solution talks to the other. The result is models that are better explained but still operating on an incomplete picture. Or models with richer context that remain inscrutable.
What's needed is an architecture that solves both at the same point of the stack. That is what contextual graphs are designed to do.
What a Contextual Graph Changes
A contextual graph changes how information is organised and accessed. It represents the borrower alongside relevant connected entities: directors, shareholders, group companies, counterparties and guarantors. Filings, adverse events and ratings can be linked to the entities they concern.
This gives the decision system a relationship-mapped view of the borrower, subject to the coverage and quality of the available data. Supporting information can carry provenance: where it came from, when it was obtained and which source document it references.
When a system flags a relationship, the analyst can follow the evidence through the graph. Which entities are connected? What is the nature of the relationship? What document supports it?
To establish why that relationship affected a score or decision, the institution also needs to capture the rule, model explanation or analyst judgment that connects the evidence to the outcome. A traversable evidence path is valuable, but it does not automatically reveal a model’s internal computation.
The OmniGraph illustration below shows how a company can be examined through its relationships.
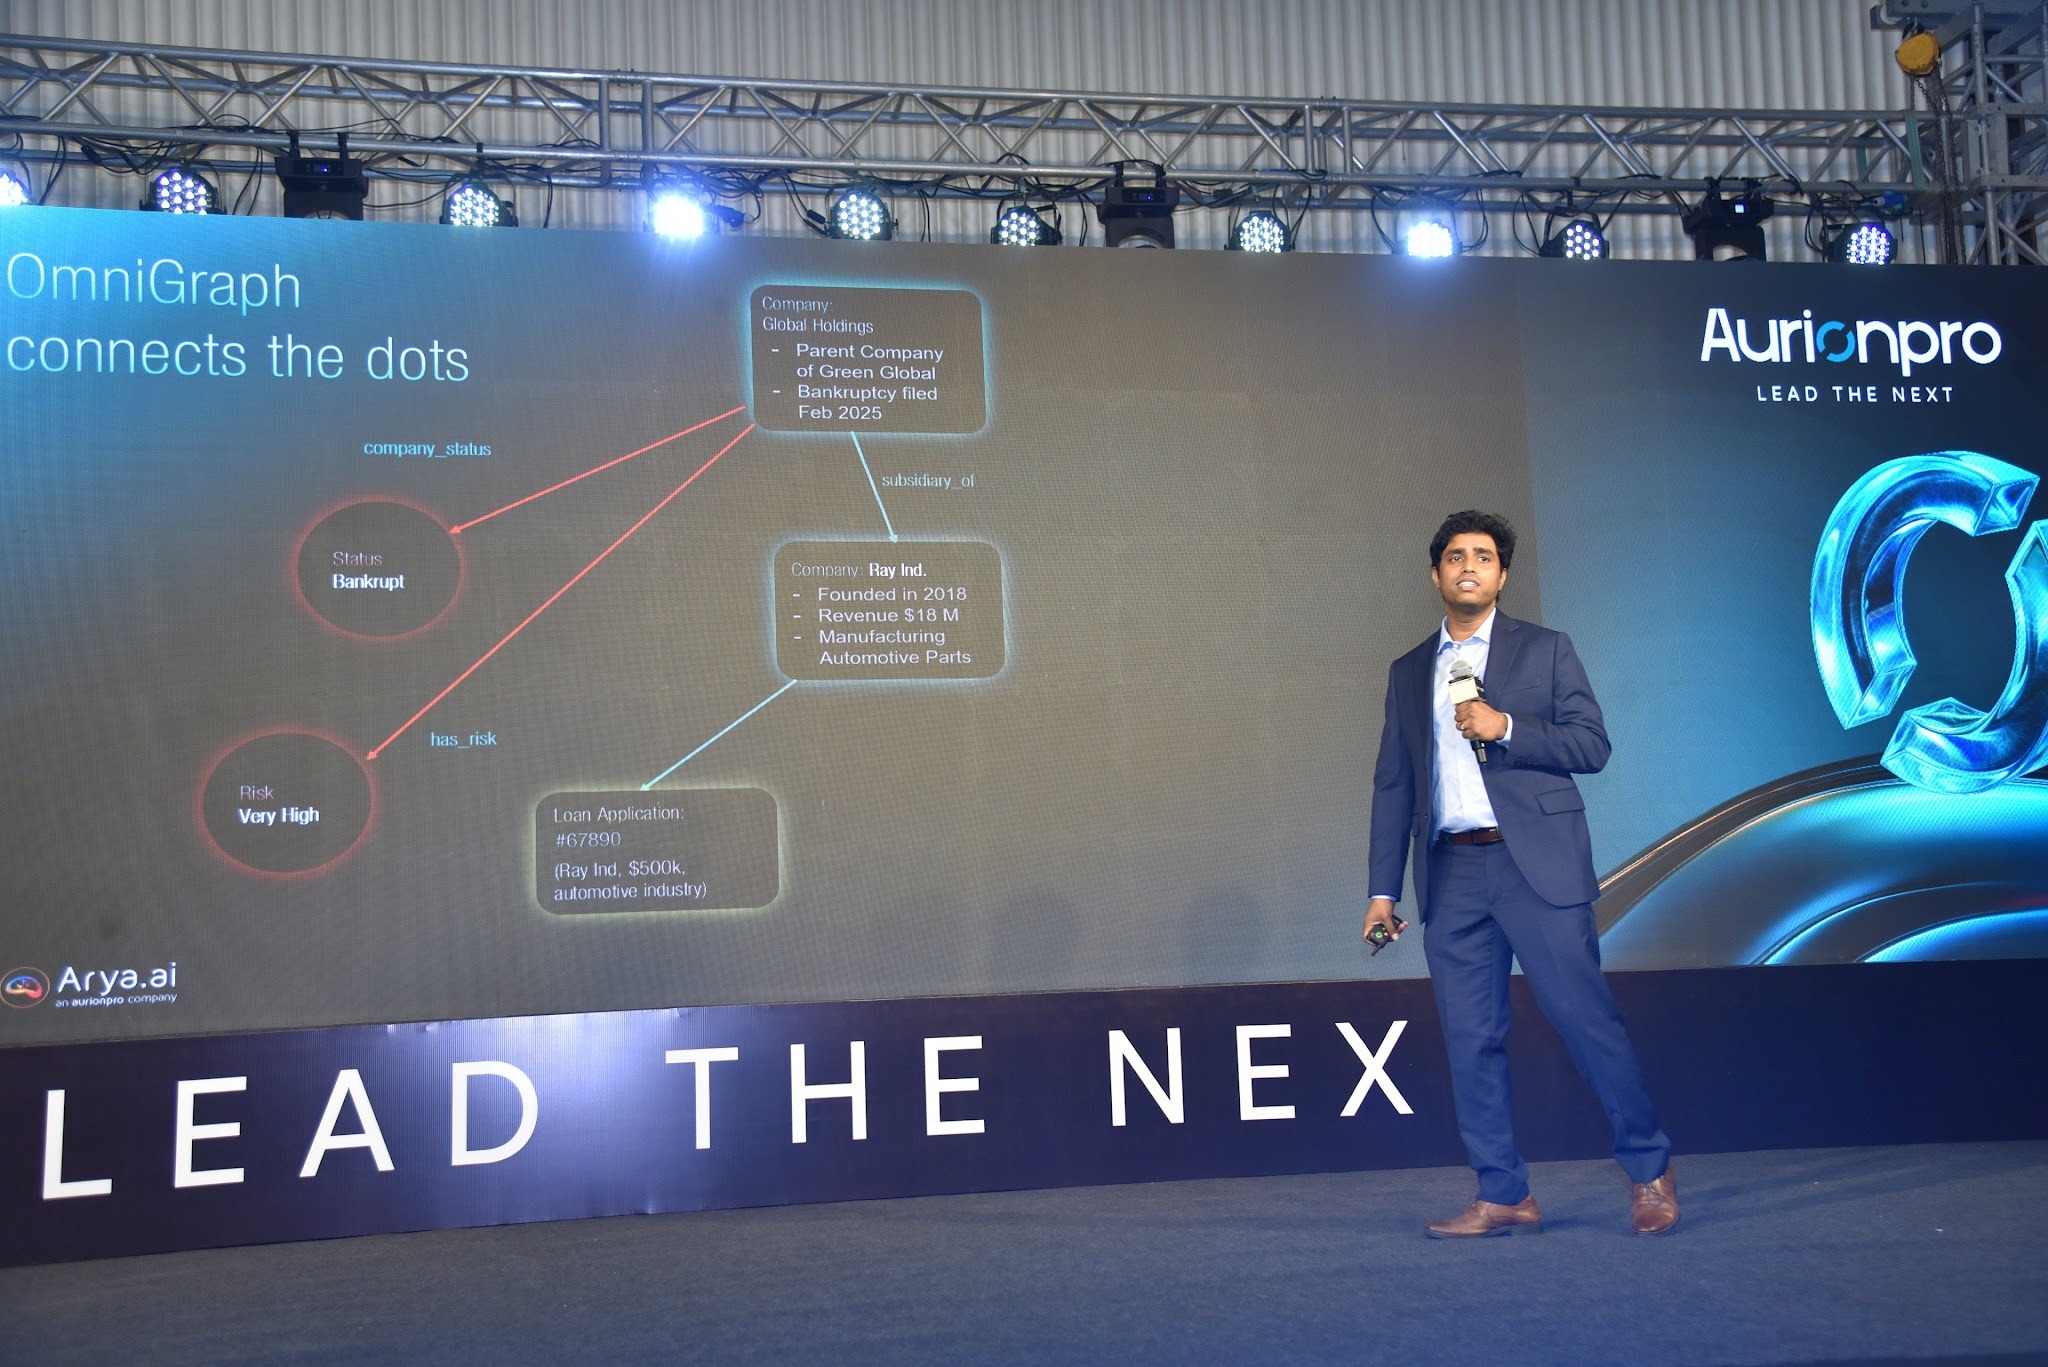
But OmniGraph traces that Ray Industries is a subsidiary of Global Holdings. And Global Holdings (the parent company of Green Global) filed for bankruptcy in February 2025. That signal lives in the relationship between entities, so it’s not traceable in the company’s financials.
A conventional model, working from the borrower's own data, cannot see it. However, the graph traverses from the borrower node to the parent node in a single step, surfaces the bankruptcy filing as an adverse event, and propagates the risk signal back to the application:
company_status → Bankrupt. has_risk → Very High.
The analyst can see the parent-subsidiary relationship the system flagged. Not only has the model made a more accurate decision, but it is also auditable. If a regulator wants to see the reasoning or the borrower challenges the outcome, the institution can showcase exactly how they came to the decision. This finding can be brought up with the borrower, and the lender can seek clarity.
How Contextual Graphs Support Traceable Decisions
To understand the architecture, it helps to distinguish the graph from the mechanisms that use it. A credit model may consume graph-derived features. An LLM may retrieve graph evidence to support an analysis. A rules engine may flag a defined relationship for review. Each requires a different account of how its output was produced.
Four elements help connect these operations to an auditable record.
- Evidence Nodes. Entities, events and source records are represented in the graph. Verified facts, source assertions and model-generated inferences should be distinguishable, with confidence and verification status recorded where relevant.
- Relationships and Decision Logic. Edges describe relationships such as ownership, guarantees or transactions. An ownership edge establishes a connection; the rule or model that interprets it determines its significance. The record should link the relationship to the rule applied, the model output and its explanation, or the analyst’s documented judgement.
- Temporal and Provenance Metadata. Records need source references, transformation history and relevant dates. The system should distinguish when an event occurred, when it became known to the institution and when a relationship was valid. Updates should preserve the history needed to review earlier decisions.
- Decisions as First-Class Records. A decision can be represented as an entity linked to the evidence actually used, the model and policy versions, the output and any human review or override. Recording a decision this way creates an audit structure; its completeness depends on what the surrounding systems capture.
Together, these elements connect evidence, processing and action. Model explainability methods remain relevant wherever a learned model influences the outcome. Their findings can be linked to the underlying evidence in the same record.
From Opacity to Accountability: What This Enables
Contextual graphs bring an accountability shift that gets manifested differently at each level of the organisation.
- For credit analysts, the difference is between reviewing a score and reviewing evidence. When the reasoning is visible, the judgement can be documented and defended.
- For risk officers, model performance becomes examinable at the level of reasoning, and the errors can be tracked to a specific relationship or data node.
- For compliance and audit, the question "why did the model make this decision?" becomes answerable on demand, for any decision, at any point after the fact.
- For borrowers, a denial is no longer a verdict without a reason. A business can understand what information influenced the assessment and, where appropriate, provide context that changes the picture.
This is what genuine auditability looks like in a regulated lending context.
The Condition That Makes This Possible
One point deserves emphasis, because it is often missed in conversations about AI transparency: the quality of the graph determines the quality of decision auditability.
A graph built on incomplete, unverified, or poorly maintained data produces traceable decisions that are wrong. Traceability is necessary but not sufficient. The nodes have to be accurate. The relationships have to be current. The provenance has to be real.
The model doesn't need to be retrained to incorporate this. The knowledge is in the graph, and the model reasons over the graph. This is the architectural distinction that makes contextual AI fundamentally different from AI that simply gets better data at ingestion time.
The Question for Risk and Technology Leaders
The conversation around AI in enterprises has spent considerable time on model performance — accuracy rates, default prediction, discrimination scores. These are important, but banking demands more than just model performance. Since humans are accountable for decisions AI makes in this industry, they need to understand what AI is doing.
The move toward contextual, knowledge-graph-grounded AI is a move toward decisions that are transparent by construction. The evidence trail exists before the model runs. The reasoning is in the graph, not inferred from it after the fact. The human can follow the logic not because an explainability tool has estimated what the model probably did, but because the model's context is structured, stored, and navigable.
In credit risk — where the consequences of decisions are material, and the accountability for them is real — that is not a technical distinction. It is a fundamental one.
Share this post


Table of contents
Low-Code AI Automation Starts Here – Try Arya Apex


.png)




.png)
.png)
.svg)


